
One Chart to Rule them all – Infographic Shootout Part 2
As some of you know, I’m a visual learner. Point being, I LOVE infographics! A few years ago, my colleague wrote a short blog about Infographics for Beginners. But a lot has changed online and I’d like to give a walkthrough of all the cool new tools available if you need to convey lots of information in an easily readable, bite-sized infographic — or maybe you just want to have some fun stuff to post on your social media channel! I made a quick infographic using each of these sites to demonstrate their capabilities with a brand, so keep that in mind before you begin to ask where I got the following images from. So without further ado, here we go:
1. Canva

Do you… Dare to Dream… or Dream to Dare
Canva is the first on our list of free infographic or just general graphic tools. When you first open the program it’s a little confusing as to what exactly you should do. Many of the options are listed as premium only, meaning they cost money to you. The cost for the options are cheap however, so that’s a plus. Once you do figure out which options are free and begin realizing that you can just drag and drop images from your computer straight onto the canvas (haha I see what they did there), the program really begins to show potential. The ability to import images directly from Google Drive and Facebook definitely helps. Canva is also one of the only programs that immediately gives you the correct sizing for different mediums, whether it be for a Facebook/Pinterest Post, a presentation in PowerPoint, or a physical print poster. However, as an infographic tool it kind of falls short compared to the other options. I could not figure out how to import actual raw data to generate accurate charts. In spite of this, for a free in-browser graphic manipulation software it’s pretty solid and I definitely will be using it in the future for general graphical work.
2. Visme
 Steps to Starting Your Own Rock Band
Visme is an interesting program. It uses a very straightforward user interface that makes me feel like I am using a photo manipulation program like Photoshop or a document editing program like Pages or Publisher. On par with most infographic tools, the ability to input spreadsheet data is very easy to do.
3. Easel.ly
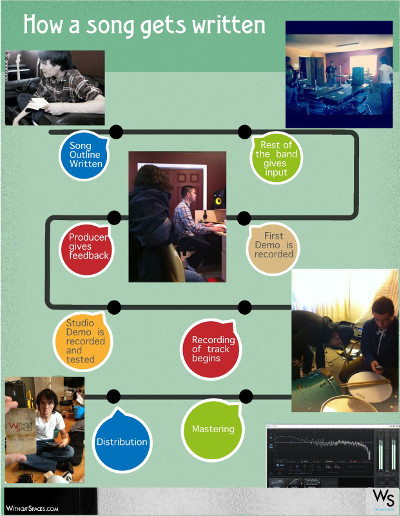
How a song gets written
In a previous blog, my colleague mentioned she liked Easel.ly because it was so easy to use. The same stands true now as I threw together this little chart in a couple of minutes.
4. Piktochart

The Piktochart program is pretty good. It can an be a little complicated initially, but the use of what the program calls “blocks” makes the whole experience feel like I’m working within PowerPoint instead of a graphics program. Overall the experience was enjoyable and Piktochart works great if you are going to build an infographic list or step-by-step instruction sheet.
In summary, each program has a very unique feel to it. I would definitely recommend Canva if you need to do quick image manipulation before you post onto a social media site. I would use Easel.ly or Visme to do your standard type of infographic or step chart, and I would use Piktochart if you want more of a presentation feel for your image. Thanks again for reading. I hope you learned something and I look forward to seeing you guys next time!
Have a site that we missed? Think there’s a better resource for making infographics? Prove it by leaving a comment below!
Mack, along with being a marketing associate at Orion, also sings in the shower and sometimes on stage. Check out his tweets as a high tech marketing rock-star, @Mack_Ortis. Maybe if you’re really nice he’ll sing something for you?