
Growing in the Asia-Pacific Marketplace (Part 3)
This is the final entry of a three-part blog series on Growing in the the Asia-Pacific (APAC) marketplace. In the first entry we discussed the market dynamics for 14 major countries, and presented statistics that indicate that the major share, over 60%, of American exports are sent to developed countries such as Japan, Australia and Singapore. The exports to developed countries handily exceed the share exported to developing countries in Asia such as China and India. This is something that small and medium-sized companies in North American and Europe should consider as they plot their expansion plans for APAC.
In the second entry we addressed the issues of cultural factors, which differ considerably across the region – just think a moment about the differences between Korea, Australia, and India. I suggested it is important to consider each country in its own right as you put together business plans.
In this third blog entry I look more specifically at an important consideration for business in the region – the unfortunate fact of corruption. There is an extremely wide variation in the level of corruption across the region. I tie together the business transparency score with the market potential as addressed in the first blog entry to arrive an an overall opportunity score for each of 14 nations. This is based not simply on population or GDP, but rather on openness and transparency of doing business combined with today’s potential market size, with US exports to each nation as a proxy for the latter.
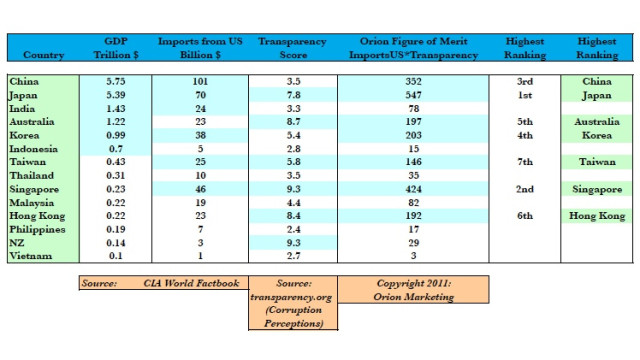
Let’s look at the important consideration of transparency and openness of business practices. A large portion of business in the region is with governments or government-owned or influenced companies. This is even more so the case in developing nations. To get a feeling for this we take a look at the Corruption Perceptions Index as formulated and rated by Transparency International. The 6 nations in APAC with the highest scores, meaning least corrupt, are New Zealand, Singapore, Australia, Hong Kong, Japan and Taiwan. In fact, all of these have better scores than the US, with the exception of Taiwan. These are easier places to do business, and one can expect better margins in these locations, both because they are more developed economies, and because they are more ethical.
A Go Smart strategy would consider both the import market potential and the ease of doing business in a given location. In the Table we have created an Orion Figure of Merit indicator that combines the volume of imports from the US with the transparency score, as a way to pull these two major criteria together. Using this Orion Figure of Merit, the top 6 countries rank ordered are: Japan, next Singapore, and then China, Korea, Australia, and Hong Kong. In addition to being markets in their own right, Hong Kong and Singapore serve as gateways to business in China in the case of Hong Kong, and to Southeast Asia and India in the case of Singapore.
Table: APAC Import Statistics and Ease of Doing Business
With a Go Smart strategy we look first to focus on more developed markets, and affinity markets, where foreign companies have the opportunity to obtain higher operating margins and where the receptivity to, and experience of, importing US technology are greater.
Orion Marketing would be pleased to work with you to assist in your development of an insightful, Go Smart, business strategy as you seek to enter the Asia-Pacific market or successfully grow your existing business in the APAC theater.
Stephen Perrenod has lived and worked in Asia, the US, and Europe and possesses business experience across all major geographies in the Asia-Pacific region. He specializes in corporate strategy for market expansion, and cryptocurrency/blockchain on a deep foundation of high performance computing (HPC), cloud computing and big data. He is a prolific blogger and author of a book on cosmology.